


Earlier this year I debuted a tool to evaluate MiLB lines in order to project fantasy value. This was a culmination of a lot of work and research and I was really proud of this first version of my model. However, in my experience with building models, you must be your own biggest critic to truly build something of true value. Ever since that first release I have been looking at the faults and flaws of the model in order to make it stronger and more valuable.
The biggest issue I noticed with the early model, was that there was no league or park consideration in the model. ISO was a key driver of my model and I realized that AAA using the MLB ball was causing issues in the results. Additionally, I realized that a player my model loved, Josh Stephen, was being boosted due to the park he played in. The underlying numbers really did not inspire the level of love the model showed. I was able to make a small adjustment to the system and I think the resulting improvement was significant.
Improvement: wRC+
Due to a suggestion from another user (@MaxSportsStudio) on Twitter, I decided to evaluate wRC+ instead of ISO. For those who do not know, wRC+ is an all-encompassing hitting metric that factors in both league and park context. So no matter the park, level, or season a hitter with a 150 wRC+ will have been 50% better than the average hitter in his league in that season. I felt that this was a massive improvement over ISO as parks have changed over the years but so have the league average numbers and overall league contexts.
Looking over the results, there are some drastic changes among players who were ranked in the top 100 in the original model.
Biggest Risers (Old Rank -> New Rank)
- Adam Hall (98 -> 20)
- Alek Thomas (81 -> 13)
- Miguel Amaya (75 -> 17)
- Alex Krilloff (99 -> 47)
- Nolan Gorman (74 -> 31)
Biggest Fallers
- Seuly Maitas (87 -> 799)
- Lazaro Armenteros (42 -> 450)
- Monte Harrison (61 -> 299)
- Starling Heredia (50 -> 126)
- Hudson Potts (46 -> 114)
There seem to be some general trends that emerge surrounding the risers and the fallers. The first group is full of hitters who posted well above average wRC+ values despite showing “poorer” power numbers. These seem to be the players who have learned how to hit at an elite level before the power comes. As for the droppers, these seem to be players with a more power centric profile. Matias had a shortened 2019, but while he had an okay ISO, his wRC+ was brutal. As for the others, their wRC+ numbers tended to trend towards league average or even below despite showing a little bit of power.
Re-Thinking
In the initial version of my model and the leaderboard app that I have built for it, I presented three values. The first was the pure number spit out by the model. I realized that this tended to favor players who were closer to the majors as the model was more confident that these players would get a chance to play in the bigs. The second value was adjusted for level context. This showed how much better than the average prospect at a given level did the model view this particular player. This helped me to level the playing field between AAA and A players. I discovered that this would be valuable for dynasty league players who can evaluate two prospects are vastly different stages in their careers. The final value was a blend of these two values. This was what I previously was using when referring to players and their respective rankings. I thought that this was the best of both worlds and was the most valuable result of the model. However, I realized that the reality of the situation is that this blended approach did not really provide much value. The most valuable part of the model is the adjusted values. This helps us to compare players across all levels and truly assess who are the best fantasy prospects in baseball. For season-long leagues, I believe it is sufficient to look at the pure value number the model spits outs when dividing which players to pick up.
New Feature: Elite Rate
I have a long list of new features and ways to leverage the model that I have wanted to incorporate and I have taken this downtime due to the pandemic to add a new toy. For the majority of these players, their poor rankings are pulled down by the uncertainty and likelihood of a zero result. I also personally know that when it comes to prospects, I do not want to draft a likely bench performer, I want to be an early investor in the future star. So, I decided to determine each players’ Elite Rate.
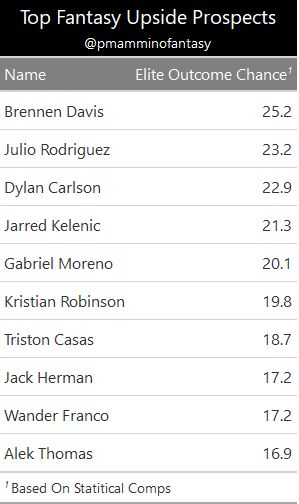
Elite Rate is quite simply the weighted probability that a given player has a 90th percentile fantasy value in MLB. In adding this feature I also made some adjustments to the sample player pool removing players who are still active in the minors but have yet to get the chance at the MLB level. This new feature is essentially a measure of player upside. It takes all players as equal and determines which players have the best chance of true impact fantasy potential.
The chart below shows the top 10 prospects in all of baseball in terms of upside chance. The biggest surprise is the leader, Brennen Davis of the Cubs. The young OF looks like he could be an absolute star in fantasy. Former model crush, Dylan Carlson still appears near the top of the leaderboards and he is one player who I am extremely excited about. This is the highest rank in any of the model outputs I have seen for consensus top prospect Wander Franco.
I am extremely excited about these updates and I think that they add a whole new series of questions to be asked and conclusions that can be drawn. I will be diving deeper into a few players on my Twitter account as well as in longer player specific posts.
As always don’t hesitate to reach out with any questions or suggestions on Twitter.
Leave a Reply
Friends don't let friends talk to themselves.
You must be logged in to post a comment.