


The shortened 2020 season has predictably lead to extreme and outlier performances. Everyone in the fantasy baseball community was expecting it. With fewer games played, there is less time to regress to the mean. We dreamed of Joey Gallo and Franmil Reyes hitting 260 with a 75 home run pace. What were the chances Jose Altuve or Charlie Blackmon hitting 400?! Preseason we collectively can waxed and waned about upside, downside, and which player profiles are more to achieve that dream stretch of games to catapult you to the top of the standings.
Now with the shortened season already evaporating before our eyes, we have Fernando Tatis Jr improving upon his outlandish 2019 debut now leading the NL with a 181 wRC+, Trea Turner sporting a 172 wRC+ with a 600+ SLG, Tim Anderson sporting another unsustainable (it’s got to be, right?) 400 BABIP, and statcast darling Teoscar Hernandez competing for the home run crown with 14 dingers before hitting the IL.
How about we make a model to put some numbers to it and get a better sense of how a shortened season can affect the probabilities of achieving different outcomes? Or more precisely, how much variably we can naturally expect for any stretch of games?
The Model and Franmil Reyes’s HR
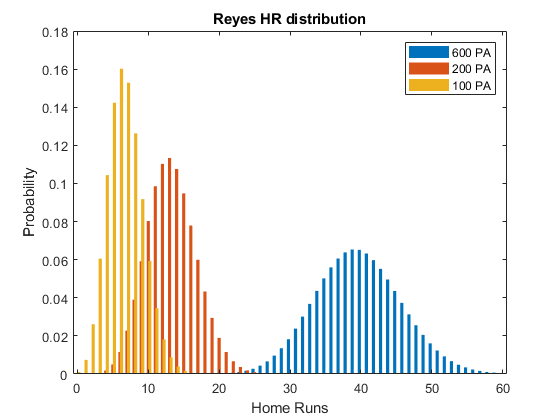
We can use a binomial distribution to model the outcomes over a stretch of any number of games. To see how this works, let’s take a look again at Reyes’s home runs. This preseason Franimal was projected to hit 14 HR over 211PA in 53 games by ATC. If would be very surprising if he actually hit 14 home runs this season, even it he had exactly 211 PA. In fact, he was probably almost identically as likely to hit 13 HR or 15 HR as he is 14 HR. My model works by assuming Reyes’s true talent level is what is reflected in the projections. On average, he is projected to hit a home run in 14 HR / 211 PA = 6.6% of his plate appearances. If we would magically freeze Reyes’s exact talent level at the preseason best estimate and gave him an infinite number of PA, we would expect him to hit exactly a home run in 6.6%.
How does this change when we give Reyes 1 million PA instead of an infinite number? Or 600 PA in a normal season? Or 200PA in a shortened season? We assume Reyes’s true talent gives a probability of 0.071 of hitting a home run in any single plate appearance. The distribution of number of HR that Reyes will hit over any stretch of plate appearances is then given by a binomial distribution.
Baseball is complicated. Incredibly difficult. Saying baseball is a game of inches under sells how tiny changes can greatly alter outcomes. But for now, forget swing mechanics. Forget the mental side of the game. Forget injury. If we assume those all stay exactly the same, we could have reasonably expect Reyes to hit anywhere from 11 to 16 HR this season. These are his 25th and 75th percentile outcomes based on this model. This range of outcomes is solely due to Reyes getting a finite number of plate appearances.

Math without numbers – An intuition into the model
A binomial distribution is what you get when you repeat a bunch of trials of an event which has two possible outcomes. A canonical example is a weighted coin. If you flip a weighted coin a number of times, a binomial distribution gives you the probability you flip a certain number of heads. For our example, the trials of an event are Reyes’s PA. The amount the coin is weighted is Reyes’s true talent for hitting home runs as given by projection systems, the 0.066 probability. The coin landing heads is Reyes hitting a home run.
With the binomial distribution in hand and publicly available high quality projection systems giving us our true talent estimate, we can can look at the distribution of HR’s expected from Reyes over various stretches of PA.

Some details of the model
Binomial distributions are well understood and commonly found in statistics, engineering, and physics. Any programming language with have tools to use them without every having to give into the underlying math. Just search “binomial pmf” and “binomial cdf” with your favorite programming language and you can fully explore how a shortened season will affect the performance variability.
The shape of a binomial distribution strongly depends on both the number of trials (PA, AB, IP, GS, etc for our purposes) and the success probability of the trial. The farther the probability of the trial is away from 50/50, and the fewer the number of trials, the more skewed the distribution is. My original intent of this article was to explore and understand variability of this season, writing and leverage this for my and your competitive advantages in leagues. But, well, 2020…
Fernando Tatis Jr
With this framework we can think about other interesting questions burning baseball fans’ and fantasy analysis minds. For instance: Given what Tatis Jr did last year, how likely was it he is producing to this fantastic extent this year?
Last year Tatis Jr hit 22 HR and stole 15 bags in 372 PA. This preseason, ATC projected him to hit 10 HR and swipe 9 bags in 223 PA for rates of 0.045 HR/PA and 0.040 SB/PA. This year, he has is 15 HR and stole 8 bases in 199 PA. Based on this binomial distribution framework and his expected true talent level, Tatis Jr only had 1.8% change of hitting more HR and a 40% chance of stealing more bases than he has through 199 PA this season.

Leave a Reply
Friends don't let friends talk to themselves.
You must be logged in to post a comment.